I'm predicting the career of every NFL offensive skill position player. I know this is a hopeless endeavor.
Yet every year I do it, because the base rate projections that my model outputs are incredibly useful for understanding how likely certain outcomes are before adding in greater context and subjectively weighting new information. It's best to think of these projections as a way to remove the rose-colored glasses you may be wearing and as a means to remove recency bias and to combat the tendency to fall back on the availability heuristic. Prediction can be particularly difficult in a sport like football where the sample sizes are small, and where its tough to separate the ability of individuals on a team from the success of the team. On top of that, coaching staffs are constantly in flux and GMs sometimes operate with a goal in mind other than maximizing short-term wins.
To help me predict the unpredictable I have created an algorithm, inspired by baseball's PECOTA projection system, and have named it MARIOTA (Multi-Aspect Regression Interpolation & Optimization Test Algorithm). The main idea behind MARIOTA is that, for a given NFL player, it uses players with similar careers in order to model a player's career arc.
MARIOTA is a combination of multiple ideas, namely FiveThirtyEight's PECOTA and CARMELO systems as well as Bill James's Similarity Scores. As of 2021, my model is currently designed to predict (half point-PPR) Fantasy Points Per Game for skill position players over the next few years of their career. With all that said, let's go through a brief overview of how MARIOTA makes its predictions. But before we dive in here, let's look at the projection for a player who enjoyed a second consecutive MVP season last year, Packers Quarterback Aaron Rodgers, so we can get some perspective on the projection system.
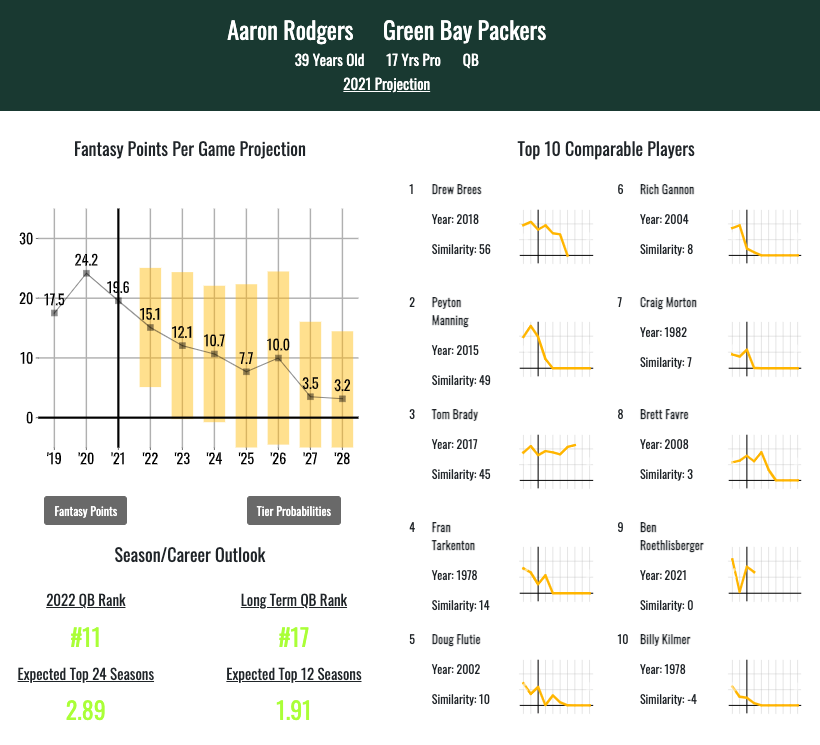
First, you'll notice, his performance over the last 3 years plotted: 17.5, 24.2, and 19.6 in 2019, 2020, and 2021 respectively. Next you'll notice that there are projections for the next seven seasons, featuring a slow decline in projected fantasy points per game over that timeframe. One important feature to note is the shaded bar surrounding each year's projection. This bar represents the 10% to 90% confidence interval of that year's projection, meaning that MARIOTA is indicating there is a 10% chance that Aaron outperforms or underperforms the confines of that shaded bar.
Next you will notice the graphics indicating the 10 most comparable players. Aaron understandably has some pretty favorable comparisons, including Hall of Famers like Peyton Manning, Drew Brees and Brett Favre among others. However, he also has a few comparisons whose careers went from elite to underwhelming in the late stages, such as Rich Gannon. You can use the buttons below the chart to toggle between a player's Fantasy Points per Game projection and their Tier Probabilities.
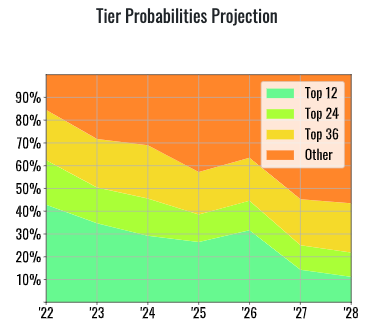
As of 2020, this new chart, titled 'Tier Probabilities' is something I'm really excited about. Traditionally, I've shared projections that center around an average projection, as you can see above. However, it can be easy to fixate on this number; however, it may be unwise to do so. The projections that MARIOTA outputs often follow what looks like an aging curve, following a downward slope. This makes some sense, after all, many players have comparables who have gotten worse over time, so the average trend (especially for older players) will be downwards. However, the curves for individual players rarely follow this nice, easy downward trend. Oftentimes, the decline takes the shape of a cliff. Adam Harstad from FootballGuys has a fantastic study demonstrating this effect, and I would highly recommend checking out his work.
What this means from a practical perspective, is that we may be better off thinking in terms of probabilities than in terms of mean projections. This is what the Tier Probabilities charts are meant to show. As you can see below, the odds of Aaron Rodgers remaining as a Top 12 fantasy football quarterback for the next few years are still reasonably high. However, on the flip side, we can see that there is a 50% chance that by 2023, he is no longer a top 24 quarterback, or worse, that he will be out of the league.
Let's talk about how we actually arrived at these projections.
Step 1 - Define Player Attributes
The MARIOTA projection system looks at players from several different aspects, 6 to be exact, and these are weighted differently depending on where the player is at in their career. These relative differences between players in each of these aspects is indicated on each player's projection and can found be scrolling the comparable player's associated graph left or right.
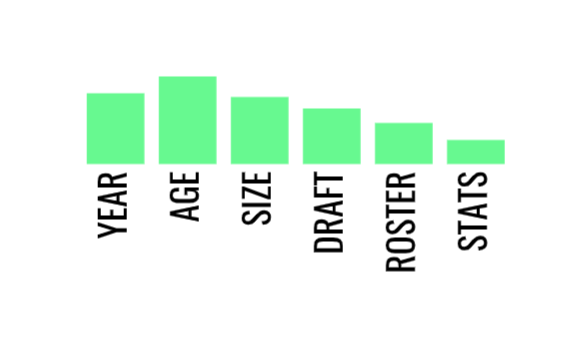
A large green bar indicates higher similarity, whereas a red bar indicates the two players are very dissimilar. Below and on each player's projection, you will find a key for which aspect each of these bars represents. Lets do a quick rundown of what each of these bars represents.
#1 - Year
The first aspect is simply the calendar year in which the player is playing. For instance, even though 1943 Sid Luckman and 2007 Matt Hasslebeck each threw for 28 TDs and 12 Ints, even after normalizing these stats for their era, this is not an apples-to-apples comparison due to rule changes and changes in the style of play.
#2 - Age
The second aspect where players are compared is their age in a given year of their career. Age has been shown to be an important factor in the success of players in the NFL. This has to do with the fact that NFL players can regress significantly with age. Consider the difference between a 28 year old running back and a 30 year old running back; those extra two years of wear and tear are probably not trivial. Alas, in most cases, players will be relatively close in age; however, we also want to clearly separate the Brandon Weedens and Chris Weinkes from their more youthful peers.
#3 - Size
The third aspect where players are compared is a player's measurables. This includes their physical attributes such as their height, weight, and if available, their NFL Combine data. A player's size and athleticism can have a significant effect on their play style and subsequently on their longevity in the league.
#4 - Draft
The fourth aspect where players are compared is their draft position. The weight given to this aspect diminishes over time because, in general, it will stop influencing decision-making regarding play time opportunities, and its predictive ability diminishes once we have actually seen a player on the field against pro competition. For instance, it is unlikely that we would predict a first-round bust to suddenly break out in their 6th or 7th season. By that point, their actual performance in the league holds more predictive weight than their potential coming out of college does.
#5 - Roster
The fifth aspect where players are compared is the player's roster situation. MARIOTA attempts to evaluate the changes to the player's team roster dynamics for the upcoming year. It does this in a number of different ways. It assesses and compares how much talent the player's team has at the player's position. It also checks whether the team has added talent or lost talent. In addition, my research has shown that AV has some correlation year to year for players that remain on the same team. However, for players that switch teams, the correlation essentially disappears, meaning that this population of players should be considered different than the population of players that do not switch teams. As of 2019, MARIOTA also considers the amount of talent in each player's supporting cast. In addition, it compares coaching staffs for players and any overlap leads to players having greater similarity with each other
#6 - Stats
The sixth and final aspect where players are compared is their statistics. MARIOTA only considers a player's last 3 seasons when comparing stats. Players are compared based on relatively basic box score stats that relate to their positions, weighted by significance. If a player does not meet certain volume thresholds for their position, such as a certain number of pass attempts for QBs, then rate stats such as ANY/A (Average Net Yards per Attempt) are not included in the comparison, since they can be misleading due to small sample sizes. All stats are normalized by season.
So if you want to understand why MARIOTA thought two players were similar, just swipe or tap on the left or right of the comparable player graph to see a graph of the different category similarities.
Step 2- Find Most Comparable Players
Once we have compiled all a player's individual attributes, then we find a list of all other players at the player's position with the same number of years experience in the league, going back to 1970. This can result in hundreds if not thousands of comparisons at certain positions. So in the case of Aaron Rodgers, we begin with a list of all quarterbacks heading into their 18th season. So once we finally have our list of comparable players, we go through that list and compare their attributes to our selected player's attributes to generate a similarity score using what is essentially a nearest-neighbor search algorithm. How this all works involves a fair bit of math, but what MARIOTA is effectively doing is starting each player off with a similarity score of 100 then subtracting points for each difference the two players have. The result of this should be somewhat intuitive.
A similarity score of 100 means the two players are identical in every way, while a similarity score of 0 means that the players are as similar as they are dissimilar. Here's a handy guide for judging how similar two players are based on their similarity score.
- 100 - identical
- 70-99 - extremely similar
- 55-69 - very similar
- 40-54 - mostly similar
- 25-39 - pretty similar
- 0-24 - somewhat similar
- 0 - as similar as dissimilar
- < 0 - more dissimilar than similar
Similarity scores can theoretically be extremely negative and are unbounded in that direction. However, we are only interested in players with a similarity score greater than zero relative to our selected player. The only exception to this is when a player does not have at least ten positive comparisons. In such cases, we expand our player pool until we have at least 10 comparable players or until we run out of players who have played the same number of seasons.
Step 3 - Making the projection
Once we have our list of players with positive similarity scores, we look at how those players performed the next 7 seasons and use that to project, probabilistically, how our selected player will perform over their next 7 years. When I say probabilistically, I mean that these projections attempt to forecast the range of possible outcomes, rather than simply coming up with one number. On the MARIOTA projection graphic, I have highlighted the average projection as well as the 80% confidence interval surrounding it. What this means is that there is a 10% chance that the player's actual AV will exceed the shaded interval and a 10% chance that the player's AV will fall below the shaded interval.
Note: The MARIOTA projection graphic for a player will only show the top 10 comparable players (if available), but all players with positive similarity are considered when calculating the projection. However, the players with higher similarity scores are weighted higher when creating the projection. Also, if a player has not yet had the chance to play 7 seasons after their comparable season, they are dropped from the projection once we reach their last available season.
Are these projections actually any good, or is this just a fancy random number generator?
By at least one common measure of model accuracy, they are actually pretty solid relative to a baseline prediction, but there are a few caveats. For one, I have not run a full analysis on all players, and have only done an extensive analysis based on the fantasy football relevant positions (QB, RB, WR, and TE).
To get an idea whether MARIOTA's predictions were any better than the baseline, I projected fantasy points per game 7 seasons into the future using MARIOTA for all fantasy relevant players from 1995 to 2011. This gave me a total of 9641 player projections. As you know, MARIOTA provides a projection that projects 7 seasons into the future, which gives us 67,487 individual predictions to evaluate. As a baseline to compare to, I used a naive or "dumb" predictor, which is simply that each player will perform exactly as well as they did the season before in perpetuity. With both MARIOTA's predictions and the naive model's predictions in hand, we can then measure how well the model does at predicting each data point. One traditional measure of model accuracy is root mean squared error (RMSE), which as the name suggests, measures the square root of the average squared error for each data point. A lower RMSE indicates a better, more accurate model. See below for the results broken down by how many seasons into the future the prediction was made by either the naive model or MARIOTA.
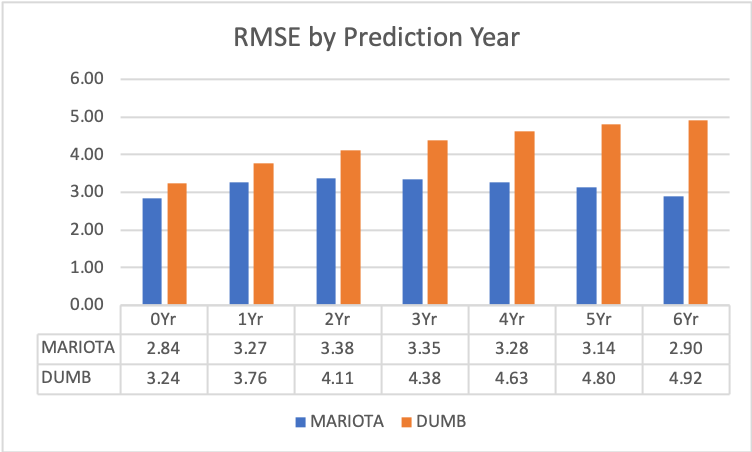
As we can see, MARIOTA outperforms the naive model, and the gap only gets wider with time, showing that MARIOTA's ability to model players deeper into their career is actually producing an edge. In fact, MARIOTA is nearly as accurate when projecting 6 years into the future as it is projecting the current season, whereas the naive model over the same timeframe has a RMSE that's nearly 50% higher.
You could certainly argue that this choice of naive model is too naive, and you may be right. However, this result does give me some confidence that MARIOTA is picking up a meaningful signal in the data. In an ideal world, we would have access to dynasty startup draft ADP's going back to 1995 that we could use as a proxy for long term player projections for fantasy players. Or better yet, we would have accurate salary data going back to 1995, and we could translate player value to expected percentage of salary cap and then use new player contracts as a proxy for NFL GM projections of player value. However, such data either does not exist or is not easily mapped to the data I have available here.
One notable shortcoming of MARIOTA is its reliance on box score stats over advanced metrics or even game film. The primary reason for this is accessibility to advanced stats is somewhat limited, and they often aren't available for seasons prior to the 2000's. Game film on the other hand can only be used in this type of analysis if you do the work to boil down what you see into some kind of quantitative input. This reliance on box score stats definitely has major shortcomings, as you can imagine; however, it is still better than nothing as shown above.
Closing Thoughts
Though I am confident in the work I have done here, some of the projections don't look great under an eye test, and they of course lack any actual football analysis or context. They are best thought of as a base rate of success for a given player. For that reason, I wouldn't advise using them for gambling purposes or to inform any other monetary decision. They were fun to put together, and I hope they are fun to look at. I always find the Top 10 comparables for each player to be pretty interesting and, in general, they seemed to intuitively make some sense. As always, enjoy and let me know what you think! You can follow me on Twitter @_luke_920. If you decide to share or post any of these projections, please be kind enough to give me credit and link to this site.